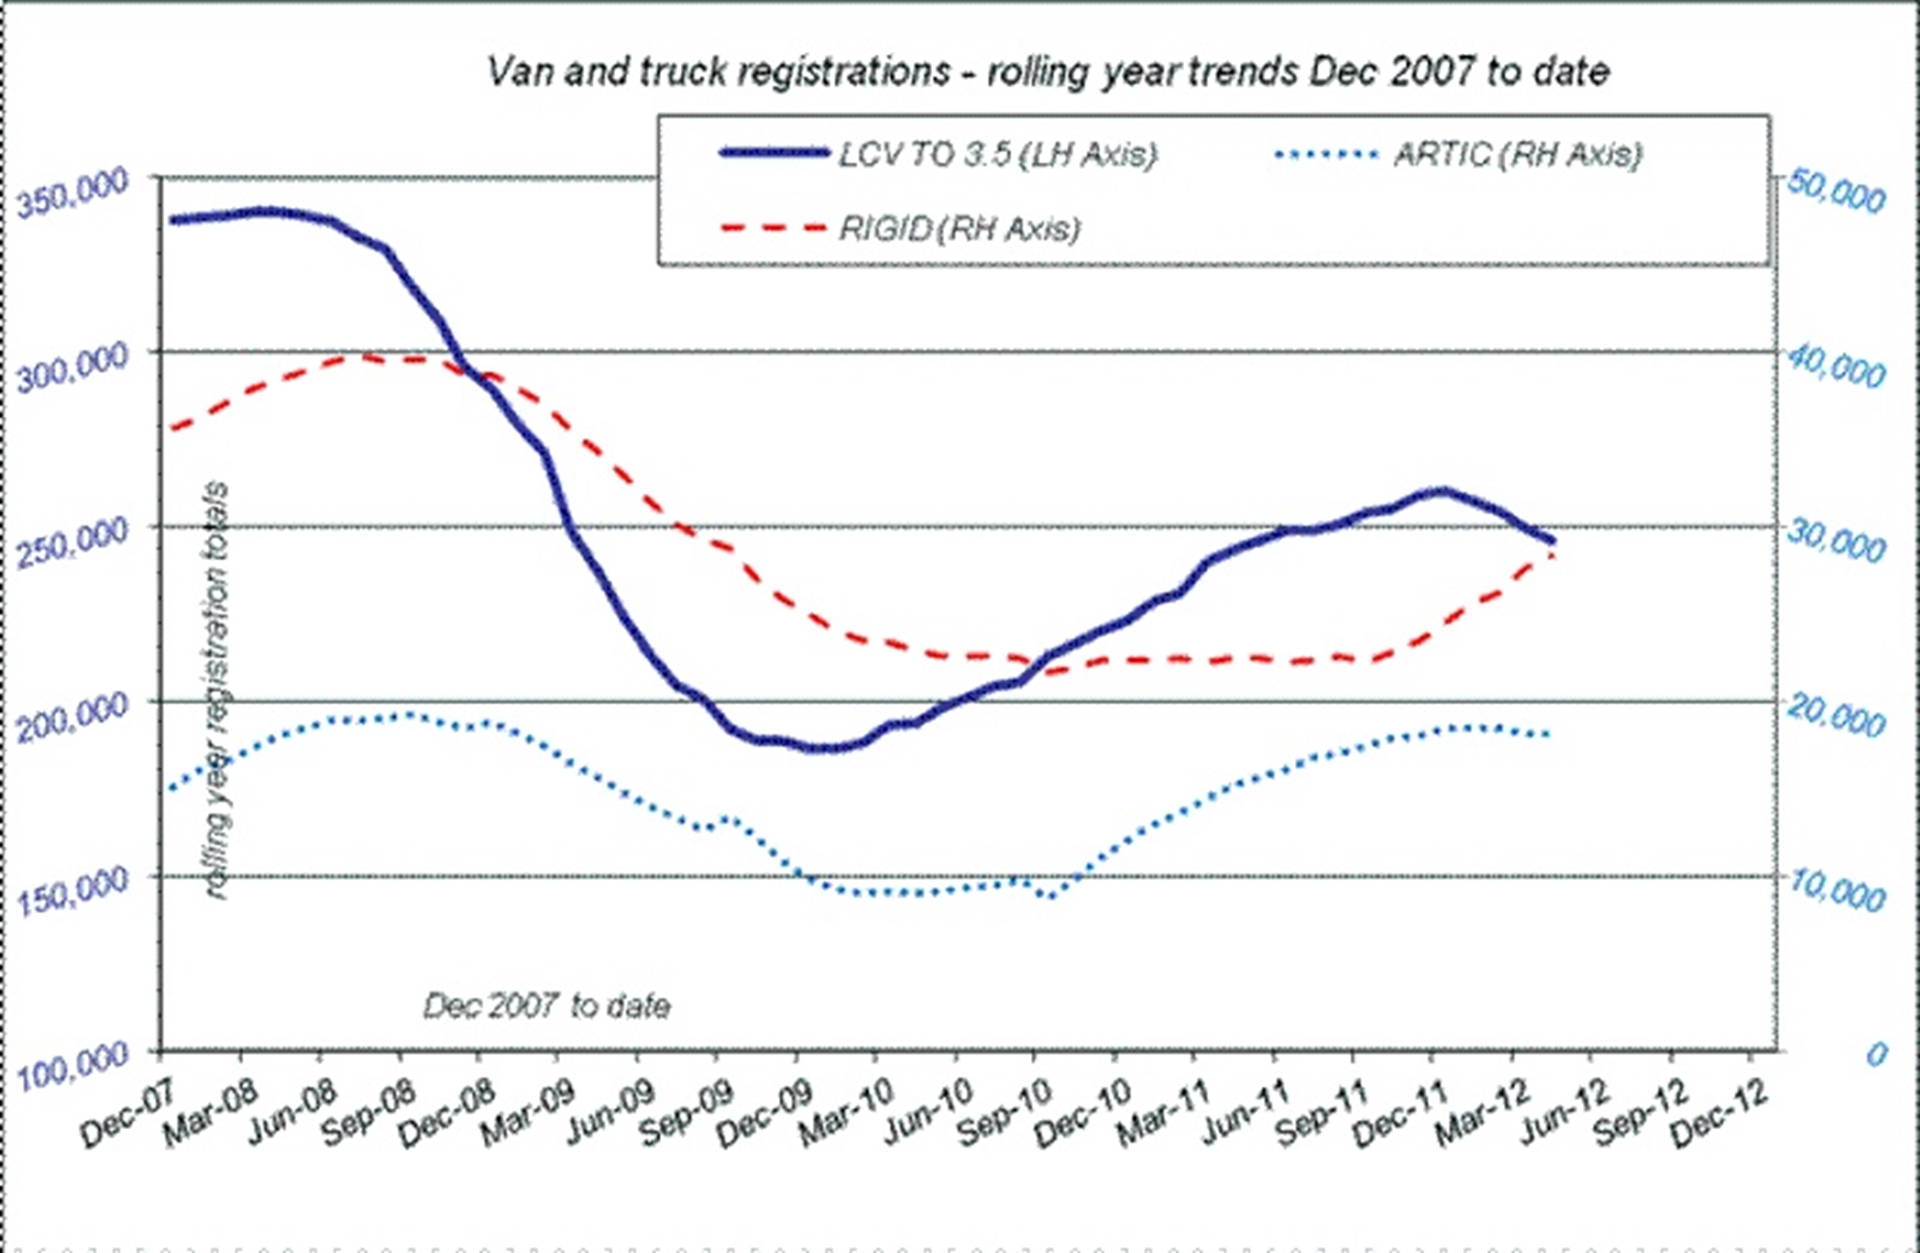
April continues market split as heavy and light CVs continue to move in opposite directions

- Van and truck market down 13.7% in April with 18,623 registrations, rolling year up 4.1% to 292,352.
- Truck registrations up 17.7% at 4,115 in the month, rolling year up 23.7%to 46,425.
- Van registrations down 19.8% to 76,196 units in April, rolling year up 1.1% to 245,927.
UK van and truck registrations: 2012 and % change on 2011
| April | % change | Year-to-date | % change | Rolling year | % change | |
| Vans | 14,508 | -19.8% | 76,196 | -15.7% | 245,927 | 1.1% |
| Trucks | 4,115 | 17.7% | 16,195 | 27.4% | 46,425 | 23.7% |
| Total | 18,623 | -13.7% | 92,391 | -10.4% | 292,352 | 4.1% |
“The relative strength of the 2011 van market continued to dent 2012 performance with the ‘up to 3.5t’ market dropping 19.8% in the month,” said Paul Everitt, SMMT Chief Executive. “Trucks remained strong, up 27.4% for the year-to-date, continuing the steady recovery seen throughout last year. Last month’s CV Show saw the launch of a host of new sophisticated and efficient vehicles that will be important to the sector’s performance through the rest of 2012 and beyond.”
UK van and truck registrations
| Month | Apr-12 | Apr-11 | % change |
| Pickups | 1,209 | 1,698 | -28.8% |
| 4x4s | 329 | 342 | -3.8% |
| Vans <= 2.0t | 2,404 | 3,298 | -27.1% |
| Vans > 2.0 – 2.5t | 1,820 | 2,351 | -22.6% |
| Vans > 2.5 – 3.5t | 8,746 | 10,392 | -15.8% |
| All Vans to 3.5T | 14,508 | 18,081 | -19.8% |
| Rigids > 3.5 – 6.0t | 626 | 499 | 25.5% |
| Rigids > 6.0 – 16t | 850 | 636 | 33.6% |
| Rigids > 16t | 1,166 | 855 | 36.4% |
| All rigids | 2,642 | 1,990 | 32.8% |
| 2-axle artics | 260 | 159 | 63.5% |
| 3-axle artics | 1,213 | 1,348 | -10.0% |
| All artics | 1,473 | 1,507 | -2.3% |
| Year-to-date | YTD-12 | YTD-11 | % change |
| Pickups | 7,475 | 10,089 | -25.9% |
| 4x4s | 2,485 | 2,410 | 3.1% |
| Vans <= 2.0t | 12,906 | 17,963 | -28.2% |
| Vans > 2.0 – 2.5t | 10,257 | 10,591 | -3.2% |
| Vans > 2.5 – 3.5t | 43,073 | 49,369 | -12.8% |
| All Vans to 3.5T | 76,196 | 90,422 | -15.7% |
| Rigids > 3.5 – 6.0t | 2,816 | 1,922 | 46.5% |
| Rigids > 6.0 – 16t | 3,579 | 2,248 | 59.2% |
| Rigids > 16t | 4,584 | 3,012 | 52.2% |
| All rigids | 10,979 | 7,182 | 52.9% |
| 2-axle artics | 805 | 753 | 6.9% |
| 3-axle artics | 4,411 | 4,779 | -7.7% |
| All artics | 5,216 | 5,532 | -5.7% |
| Rolling Year | RY-12 | RY-11 | % change |
| Pickups | 23,555 | 23,030 | 2.3% |
| 4x4s | 6,753 | 6,089 | 10.9% |
| Vans <= 2.0t | 40,509 | 45,096 | -10.2% |
| Vans > 2.0 – 2.5t | 33,566 | 30,359 | 10.6% |
| Vans > 2.5 – 3.5t | 141,544 | 138,657 | 2.1% |
| All Vans to 3.5T | 245,927 | 243,231 | 1.1% |
| Rigids > 3.5 – 6.0t | 6,428 | 6,436 | -0.1% |
| Rigids > 6.0 – 16t | 9,783 | 6,987 | 40.0% |
| Rigids > 16t | 12,110 | 8,984 | 34.8% |
| All rigids | 28,321 | 22,407 | 26.4% |
| 2-axle artics | 3,196 | 2,412 | 32.5% |
| 3-axle artics | 14,908 | 12,725 | 17.2% |
| All artics | 18,104 | 15,137 | 19.6% |
CV registrations at April 2012
- Van demand continued a downward trend in April with registrations 19.8% lower than 2011. With four consecutive monthly declines from January to April, total registrations at 76,196 units were 15.7% down on the same period in 2012; across the various van market segments types the only exception was 4×4 Utility (+3.1%).
- Yet again, truck registration growth was robust in April – the 19th consecutive month of growth. The recent upward trend in two-axle rigid volumes remains intact. Artic growth softened, now trending at around 18,000 units annually. April’s volumes have been relatively stable for some time, but were impacted by the 2009 recession and the digital tachograph changeover in 2006.


